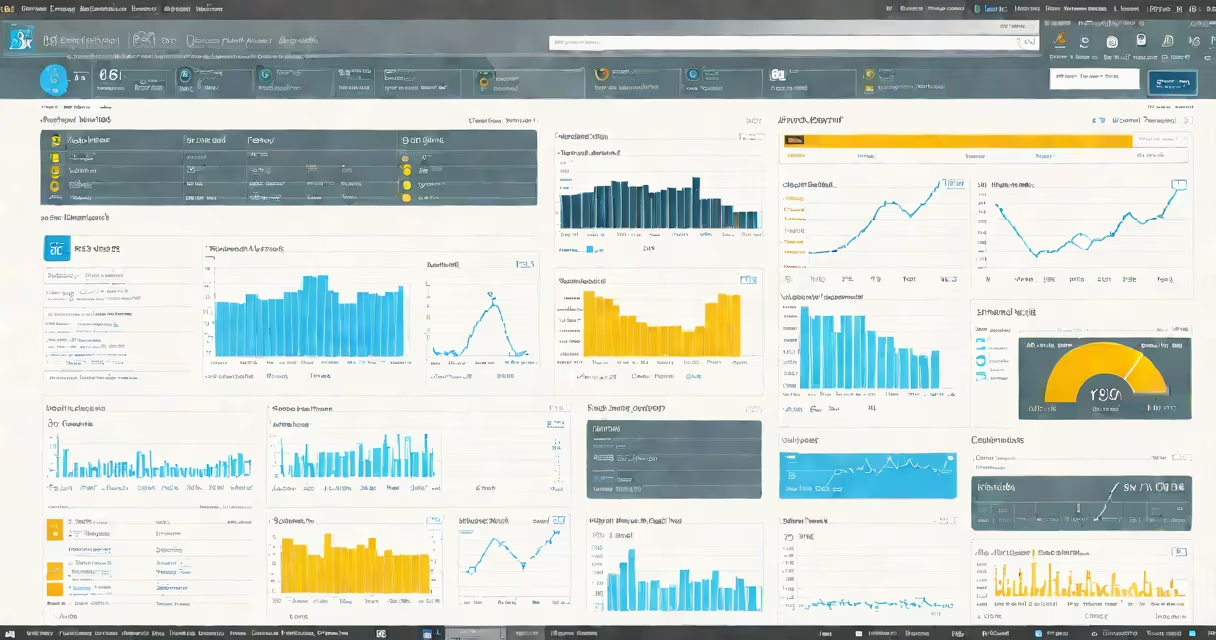
Azure Monitor Application Insights is a cloud-based service that monitors application performance, tracks user interactions, and detects errors in real time. It collects telemetry data such as requests, exceptions, dependencies, and custom events to provide visibility into application health and user behavior.
Application Insights integrates directly with Azure applications, including web apps, APIs, and microservices. It captures data automatically when deployed with supported frameworks like .NET, Node.js, Java, and Python. The service uses distributed tracing to map transactions across services, enabling root cause analysis across complex architectures.
Developers use Application Insights to identify slow responses, track crash rates, and monitor user journeys. It supports custom instrumentation through SDKs and API calls, allowing teams to log business-specific events like checkout completions or feature usage. Alerts trigger based on thresholds, such as high error rates or latency spikes, enabling proactive incident response.
When an application runs in Azure, Application Insights agents collect telemetry data from the runtime environment. This includes HTTP request duration, exception stack traces, database call times, and memory usage. Data flows into a dedicated workspace in Azure Monitor, where it's processed and stored for analysis.
The service uses a sampling strategy to reduce volume while preserving meaningful patterns. For example, if 10,000 requests occur in a minute, it may sample 10% of them but still maintain statistical accuracy for error rate calculations. This ensures cost efficiency without sacrificing insight quality.
Queries run on the data using Kusto Query Language (KQL), which allows filtering, grouping, and aggregating metrics. A common query checks for failed requests over time: requests | where success == 'False' | summarize count() by bin(timestamp, 1m). Results appear in dashboards, charts, or logs, depending on the context.
Application Insights delivers four core data types:
| Data Type | Description | Use Case Example |
|---|---|---|
| Requests | HTTP calls to endpoints | Identify slow API calls during peak traffic |
| Exceptions | Unhandled errors and crashes | Track unhandled exceptions in production |
| Dependencies | Calls to databases, external APIs, or queues | Detect timeouts in third-party payment gateways |
| Custom Events | User-defined actions like button clicks or form submissions | Measure adoption of a new feature |
Each data type can be enriched with custom properties. For instance, a request can include a userId or sessionId field to trace individual user sessions. These fields enable correlation across services in a distributed system.
Application Insights also supports synthetic monitoring via availability tests. These simulate user visits to URLs at regular intervals to verify uptime and response time. A test can ping a login endpoint every 5 minutes and flag failures within seconds.
Many assume Application Insights replaces logging tools like Serilog or Log4j. That's incorrect. It complements them. While logging provides detailed context for debugging, Application Insights focuses on performance and behavioral patterns across large-scale systems.
Another misconception is that it only works with Azure-hosted apps. It doesn't. Application Insights accepts data from on-premises servers, hybrid environments, and non-Azure cloud platforms. A Node.js app running on AWS EC2 can send telemetry using the JavaScript SDK.
A less obvious point: Application Insights does not replace end-to-end testing. It detects anomalies after deployment, but cannot predict edge-case failures. Teams must still run integration and load tests before release. Application Insights identifies what broke, not why it broke in the first place.
In a retail application, a sudden spike in failed checkout attempts occurred. The team enabled Application Insights and discovered that 87% of failures originated from a single dependency: a payment processor API.
Using KQL, they filtered requests by status code and dependency name:
requests
| where success == 'False'
| join (
  dependencies
  | where success == 'False'
) on operation_Id
| project timestamp, name, duration, success, target
| sort by duration desc
The query revealed that the payment gateway was timing out after 15 seconds. The team adjusted the timeout setting from 10 to 20 seconds and added retry logic. After the fix, failure rate dropped from 12% to 0.3% within 10 minutes.
This example shows how Application Insights enables rapid diagnosis. Without it, the team would have had to manually inspect logs across multiple services and wait hours to identify the bottleneck.
Application Insights pairs well with other Azure services. It shares data with Azure Log Analytics, Azure Functions, and Azure DevOps. For example, when a deployment triggers a new version, Application Insights can compare performance metrics between old and new builds.
Best practices include setting up alerts for critical thresholds. A rule might notify engineers if error rate exceeds 1% over five minutes. Another rule triggers if average response time exceeds 2 seconds. These alerts integrate with Slack, email, or Azure Automation.
I've used Application Insights in a healthcare SaaS platform where patient data access logs were monitored. We set up a custom event called patient_data_accessed with metadata like user_role and data_type. Over time, we detected unauthorized access attempts from a specific role, leading to tighter permission controls.
For optimal performance, avoid sending too much raw data. Use sampling and filter out noise. Only instrument events that impact business outcomes. The default sampling rate is 10%, but you can adjust it based on volume and cost.
Application Insights is part of the broader Azure Monitor set. It differs from Azure Application Insights (the product) and Azure Monitor (the overarching platform). The latter includes metrics, logs, and alerts across all Azure resources.
When monitoring infrastructure, use Azure Monitor Metrics. For application-level telemetry, use Application Insights. For troubleshooting, combine both: use metrics to spot anomalies and Application Insights to drill into root causes.
Azure Monitor Application Insights is a real-time observability tool that tracks application health, user behavior, and system performance. It works across cloud and hybrid environments, supports multiple languages, and integrates with Azure ecosystems. Use it to detect issues early, improve user experience, and validate deployments.